Vis-Sieves Explorer
Three.js
D3.js
DuckDB
Observable
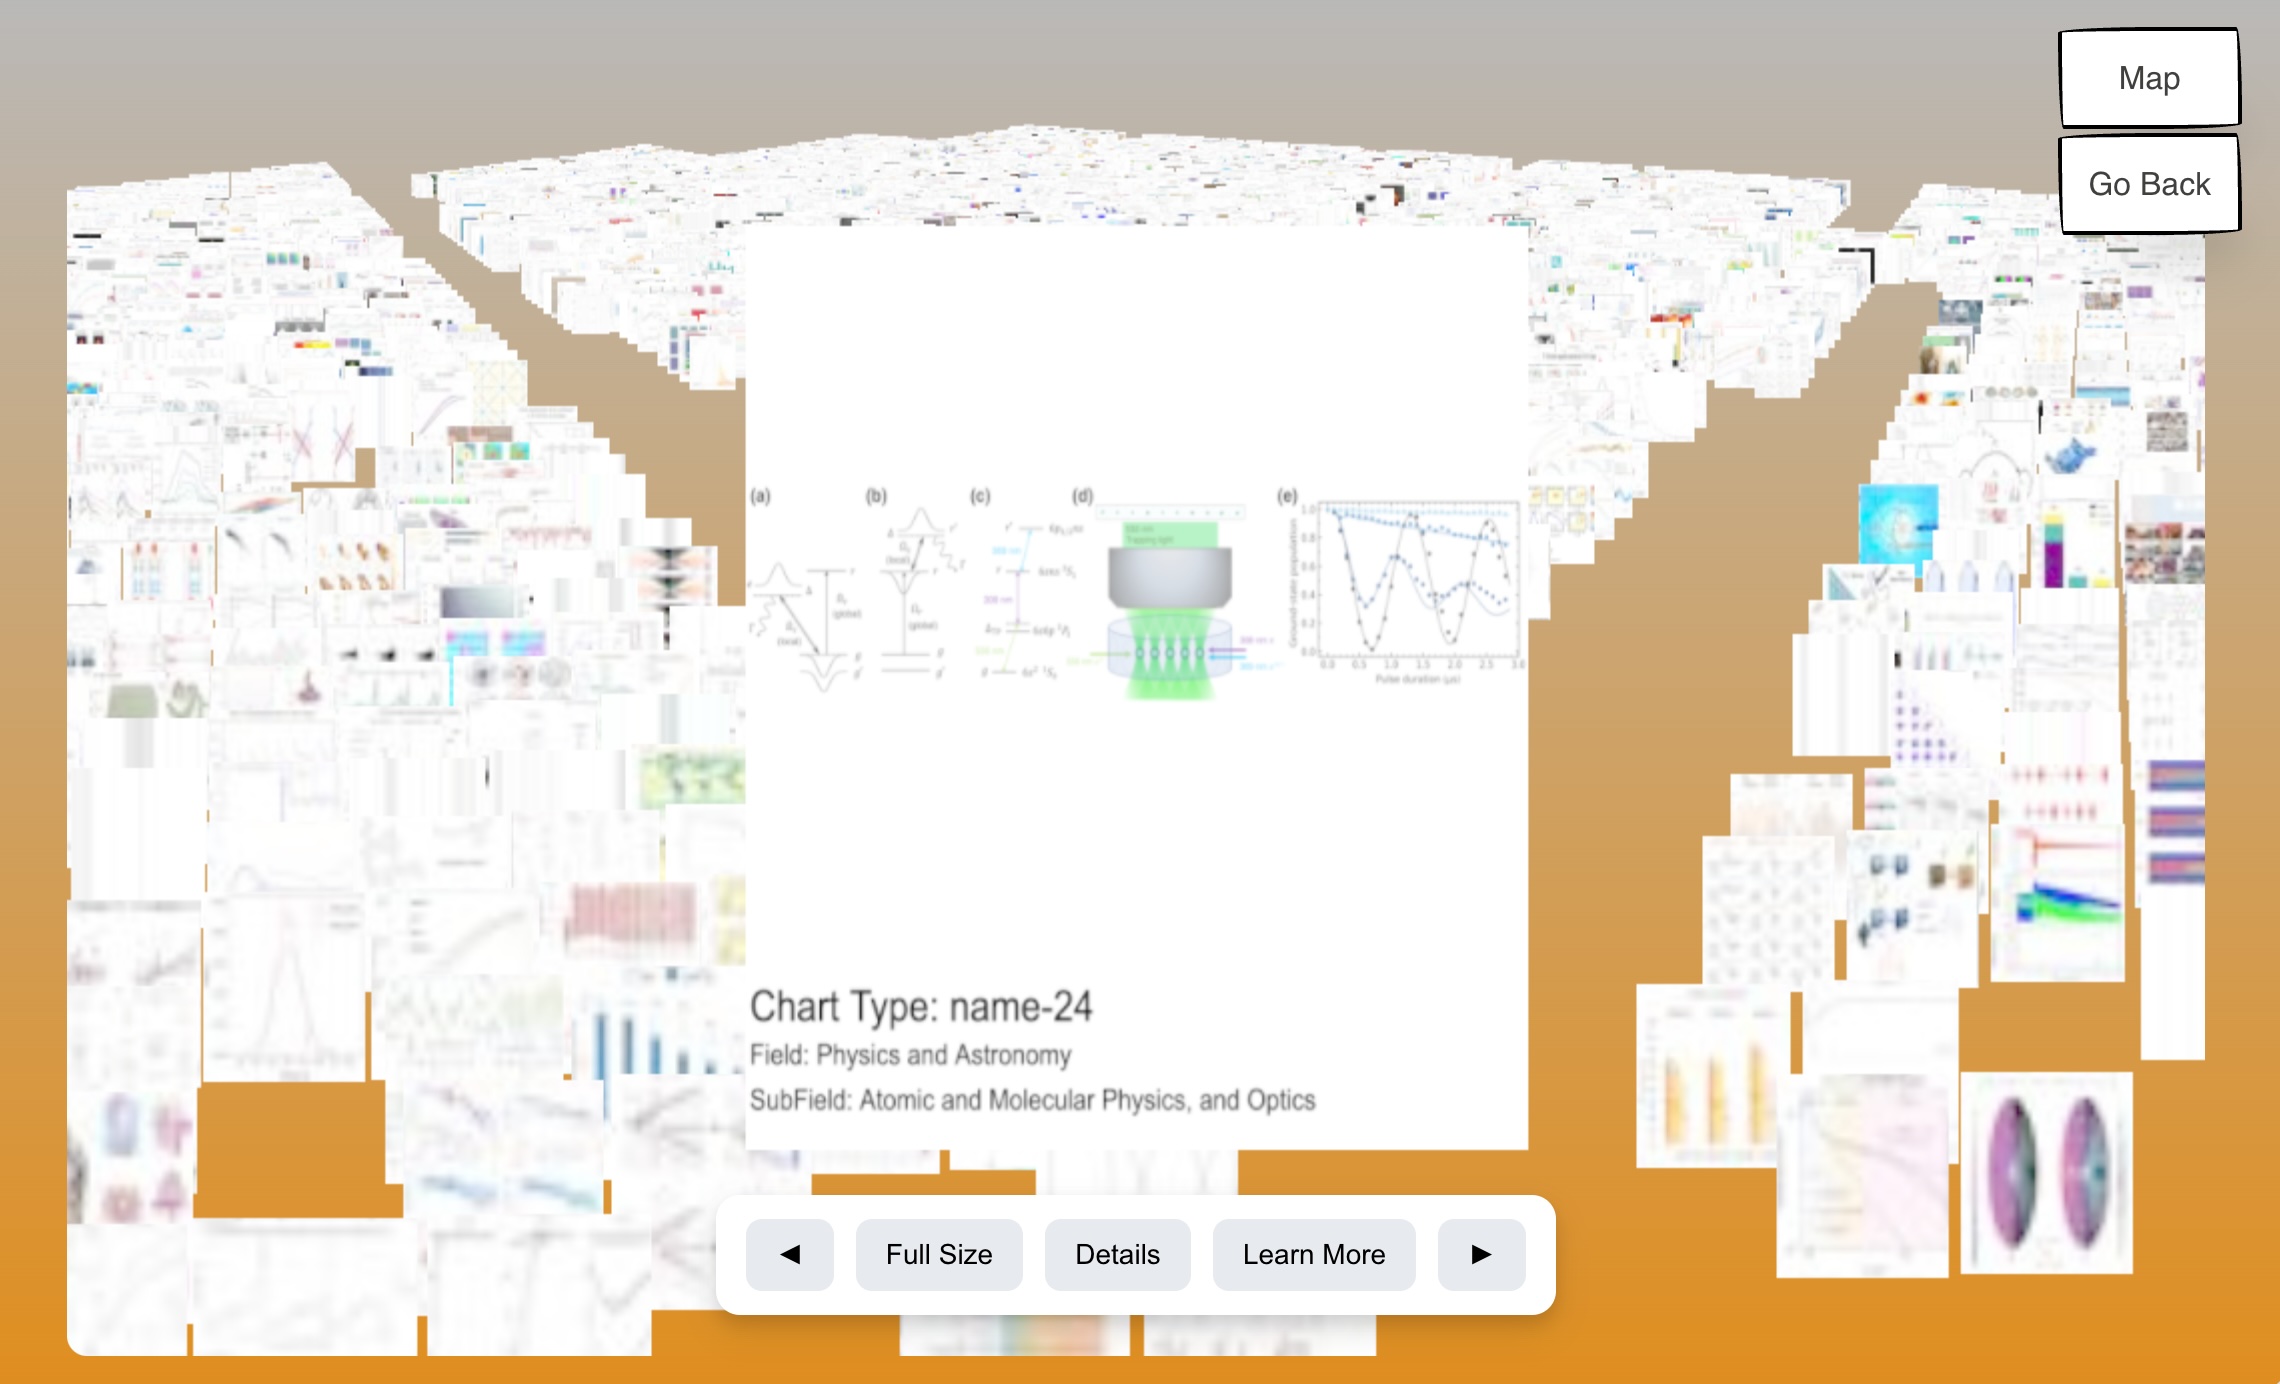
Interactive 2D/3D interface for exploring 10,000+ academic figures. Designed analytics pipeline, built Three.js frontend, created DuckDB backend with millisecond query response.

Data Visualization Specialist | Creative Technologist | Education Enthusiast
I turn large, messy datasets into clear, interactive stories for scholars and the public alike.
Research Interests:
M.P.S. Interactive Telecommunications (STEM), NYU
B.S. Interactive Media Arts, NYU Shanghai
B.S. Business and Finance, NYU Shanghai
Three.js
D3.js
DuckDB
Observable
Interactive 2D/3D interface for exploring 10,000+ academic figures. Designed analytics pipeline, built Three.js frontend, created DuckDB backend with millisecond query response.
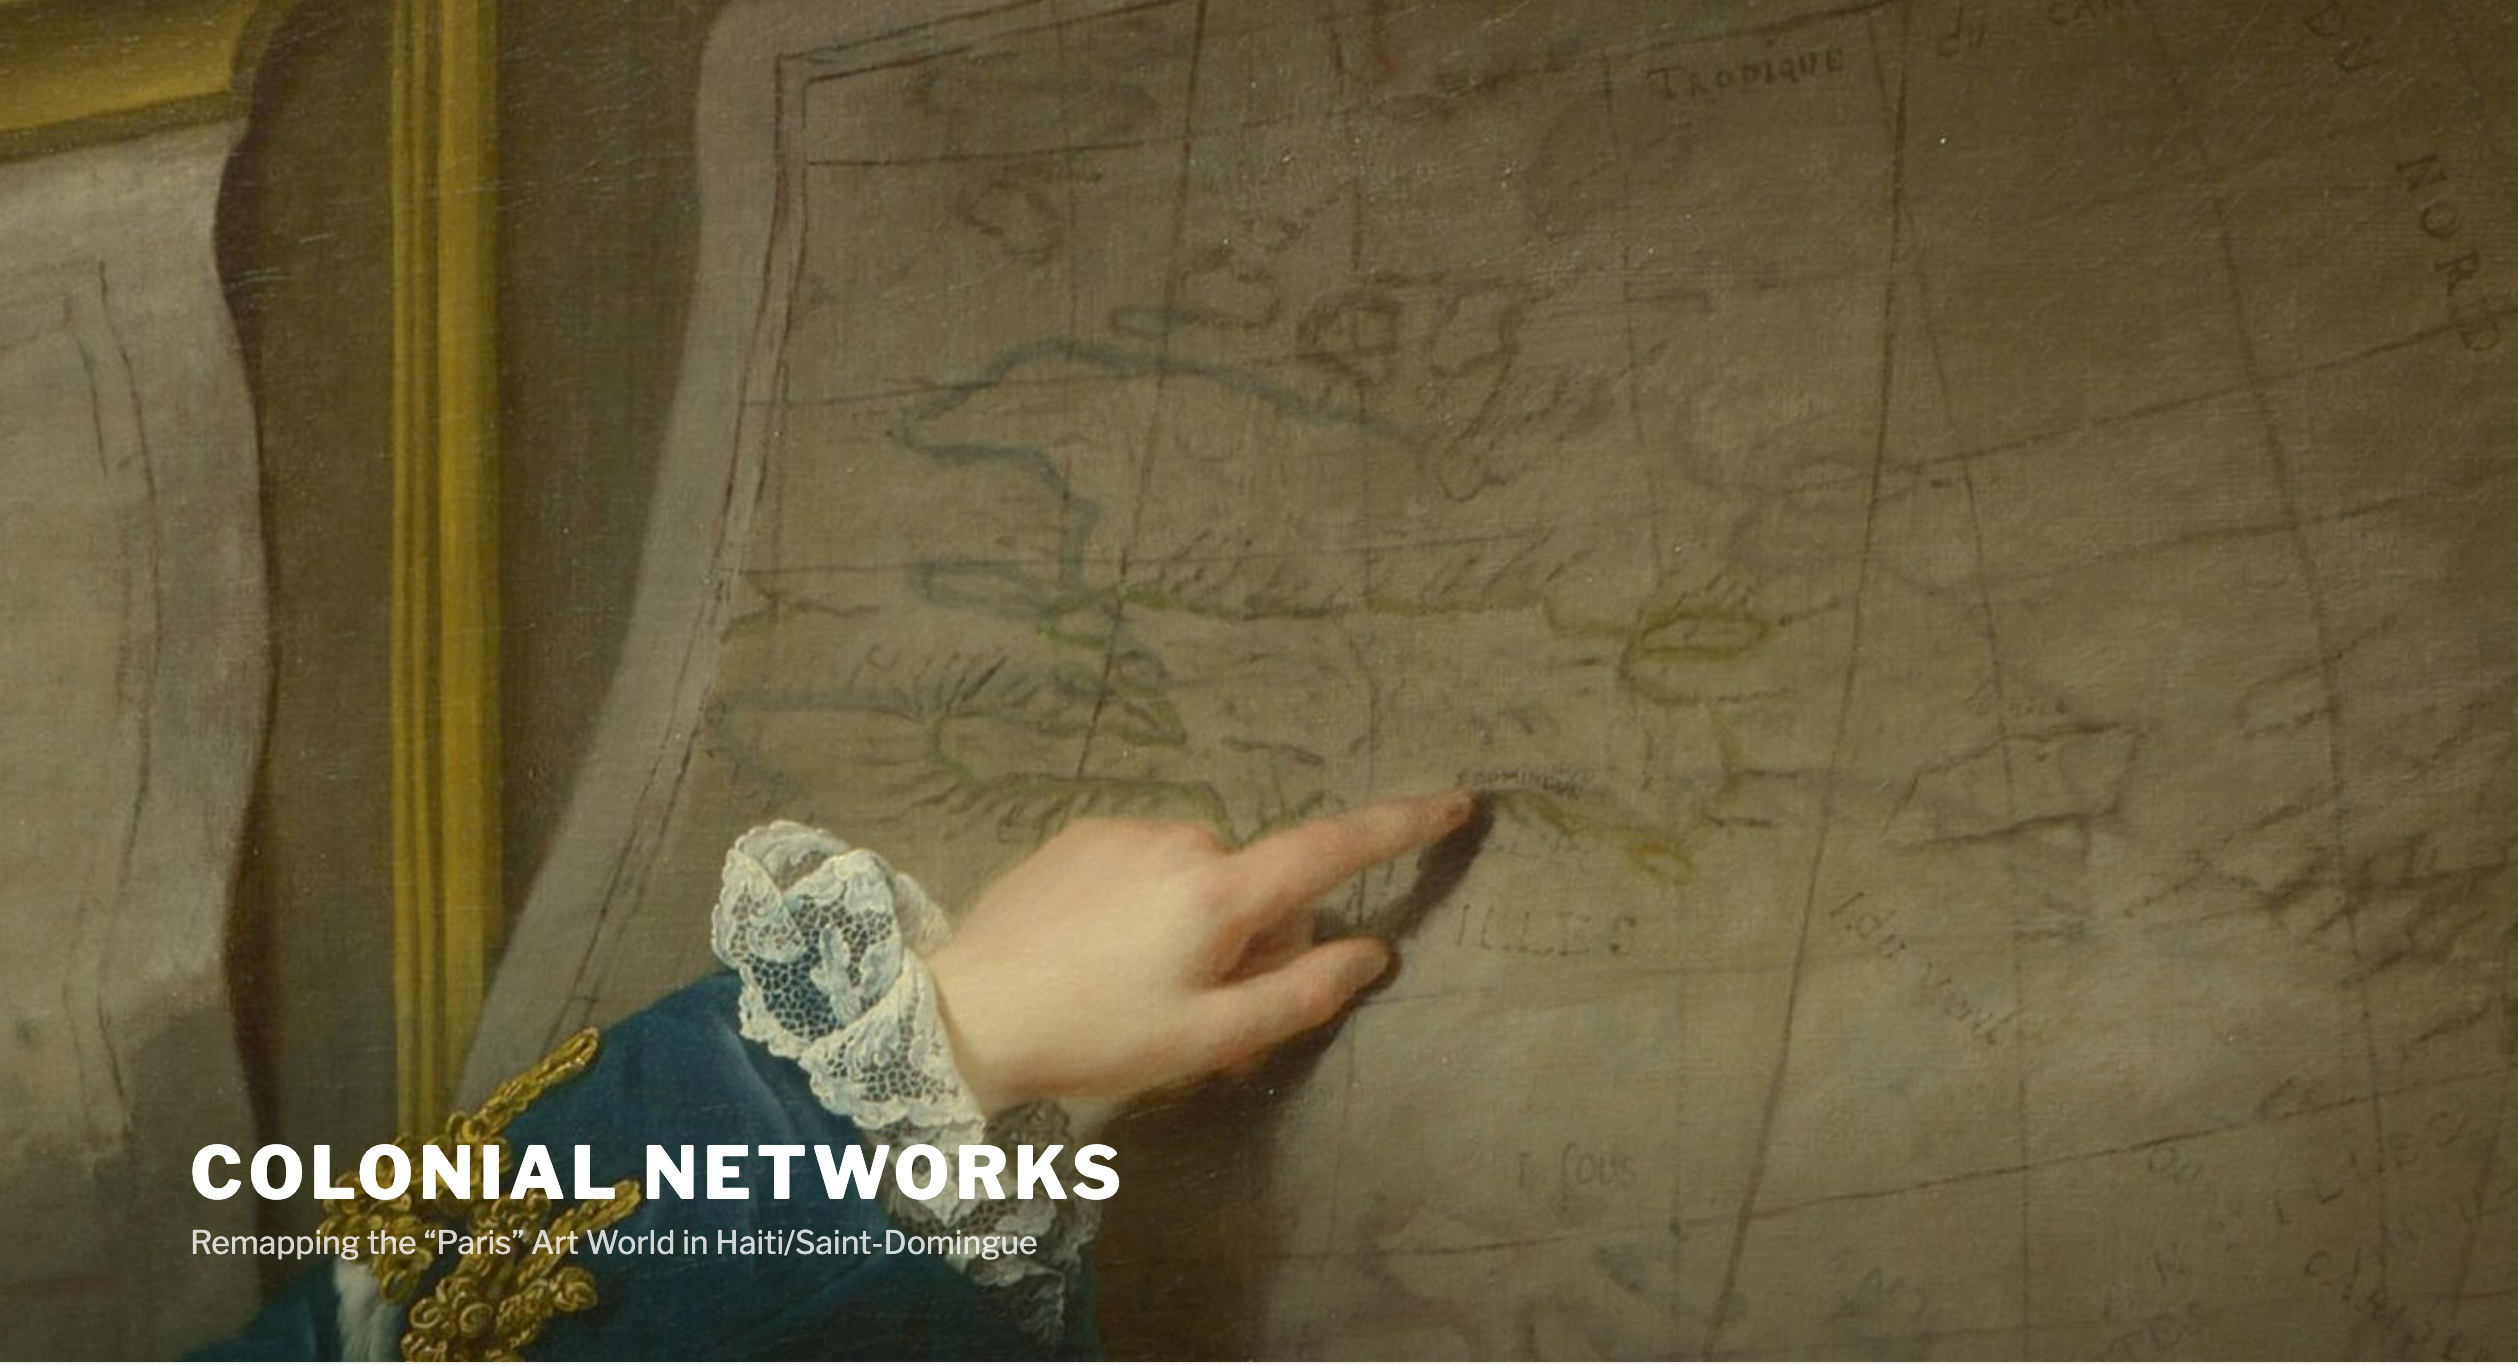
ArcGIS
JavaScript
StoryMaps
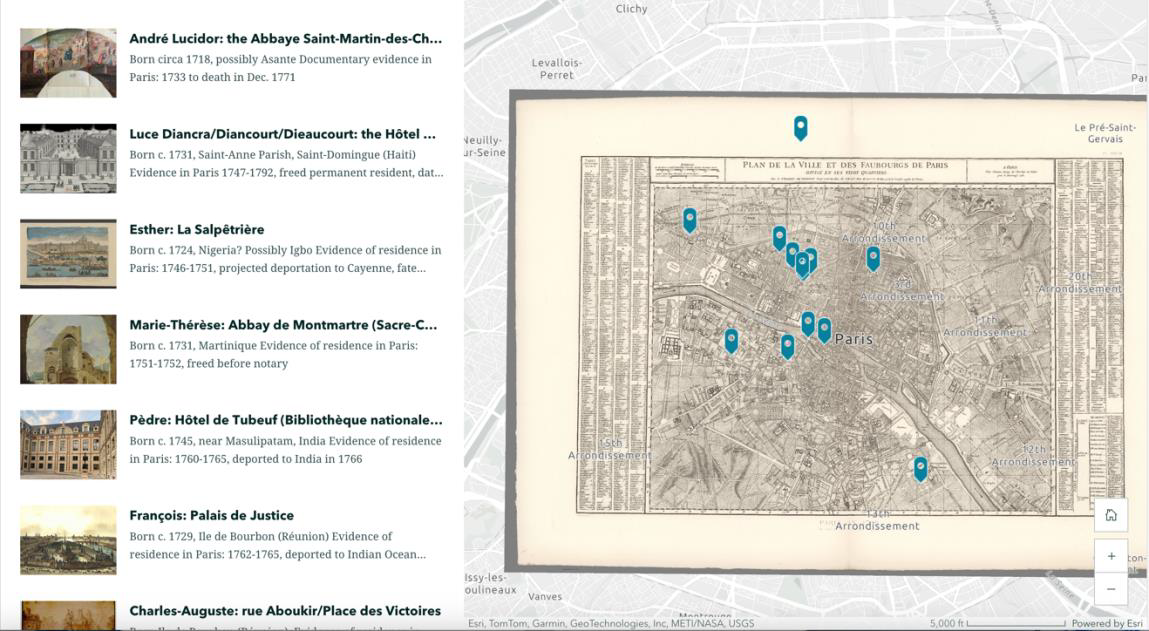
Digital humanities map tracing 13 enslaved people in 1775 Paris. Built from scratch with ArcGIS StoryMaps, custom HTML/CSS/JS, handled DNS and GitHub Pages hosting.
Leaflet
D3.js
UI Design
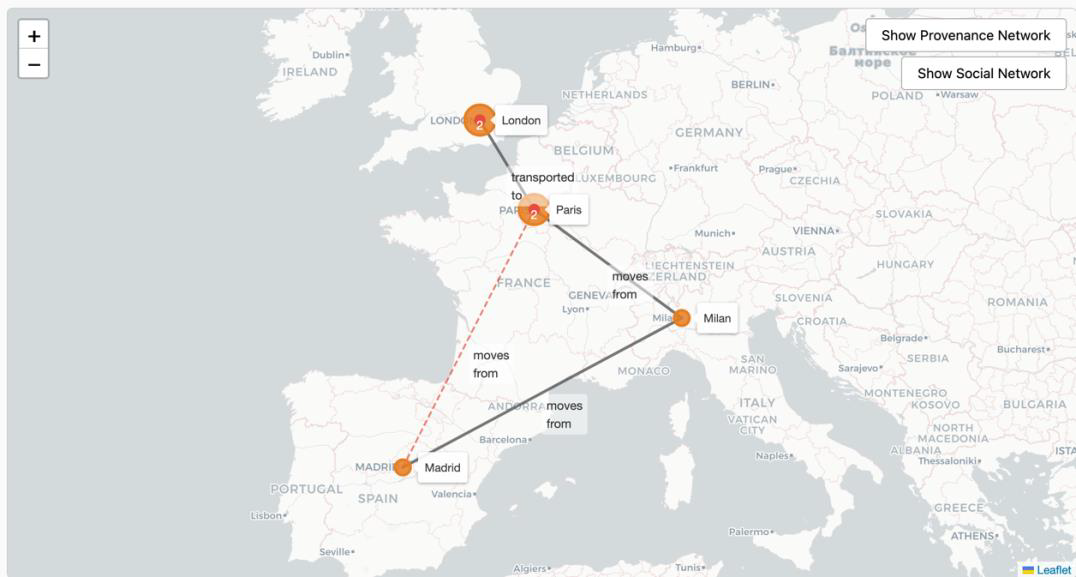
Web narrative visualizing art-market provenance data. Designed every component using Leaflet mapping and D3.js interactive charts within a clean UI.
WordPress
Database
CI/CD
Full research portal for Colonial Networks project. Developed custom WordPress theme/plugins, integrated relational database, set up continuous deployment.
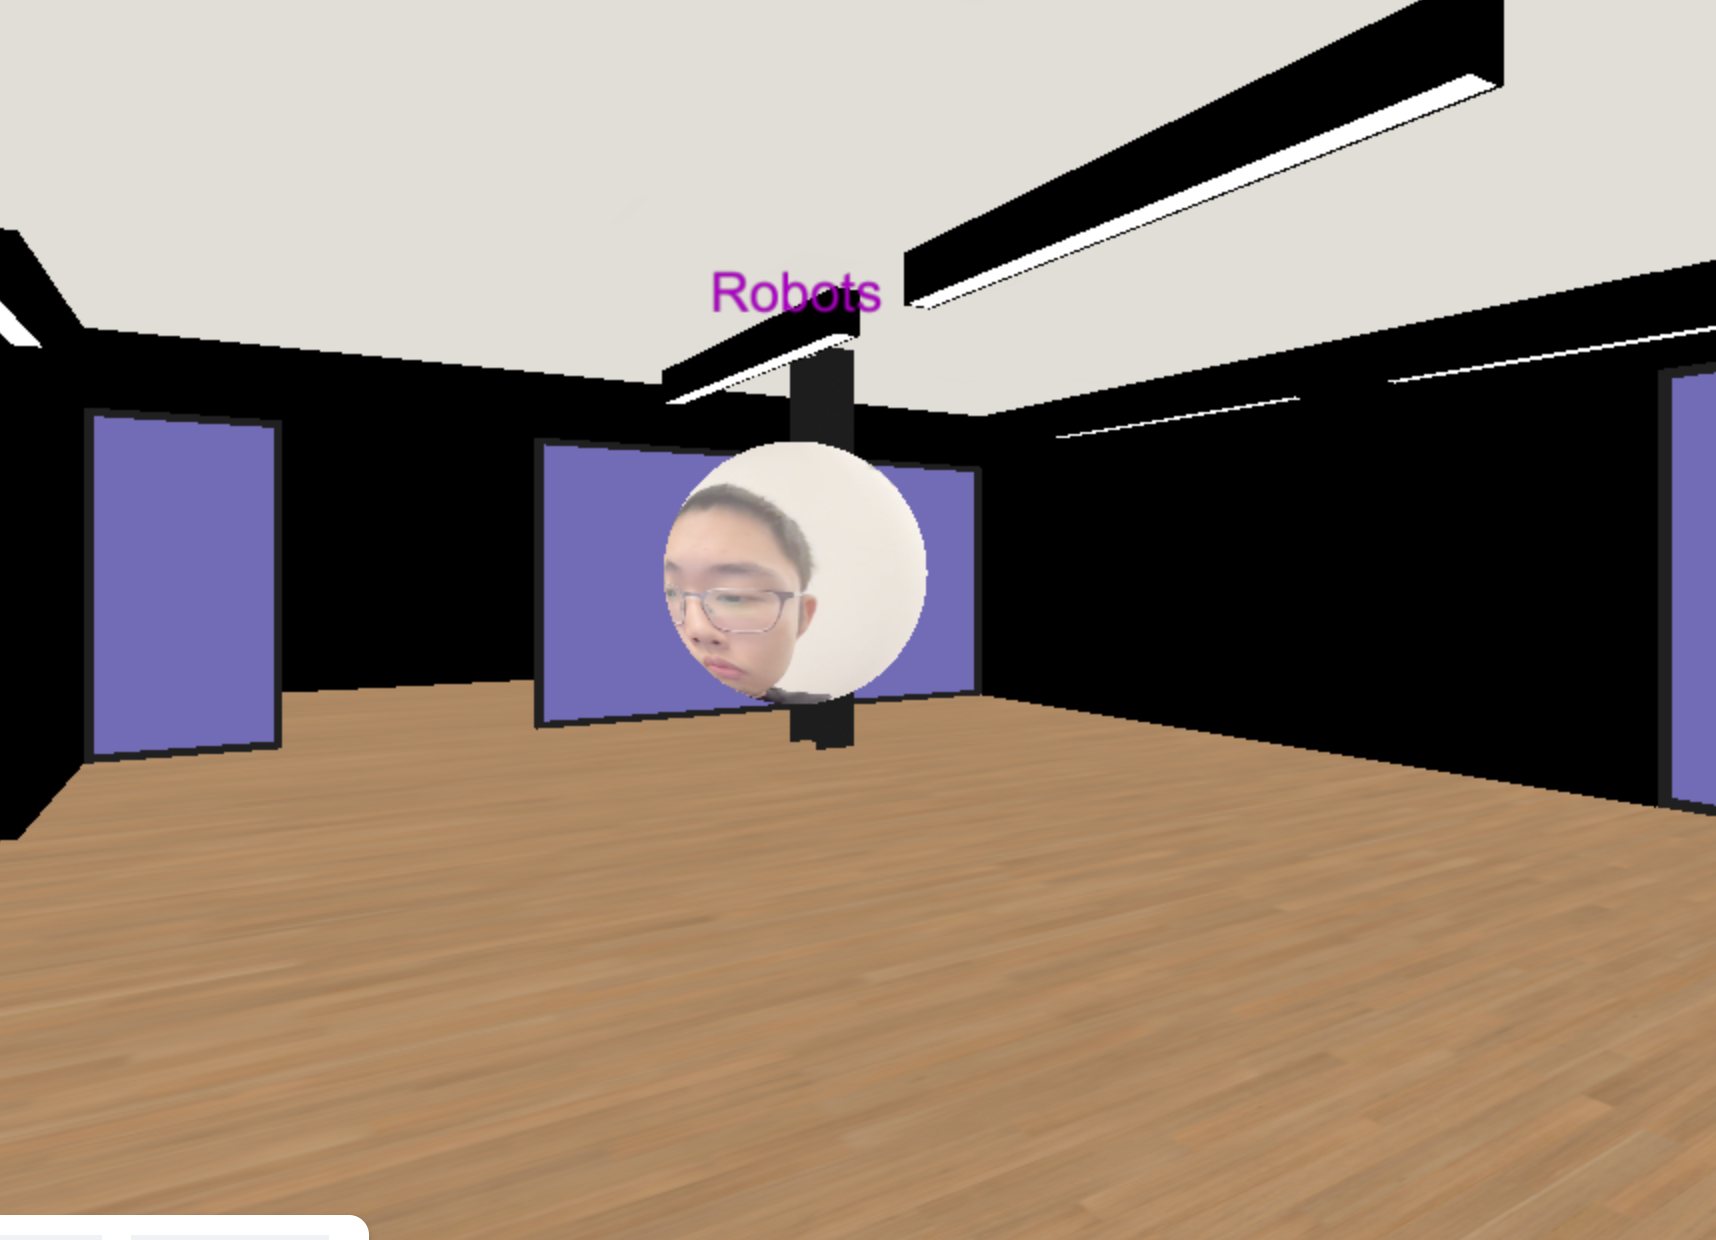
Node.js
Three.js
P2P
3D meeting space with real-time voice. Implemented P2P networking with Node.js/SimplePeer, crafted 3D scene in Three.js, led design from concept to deployment.
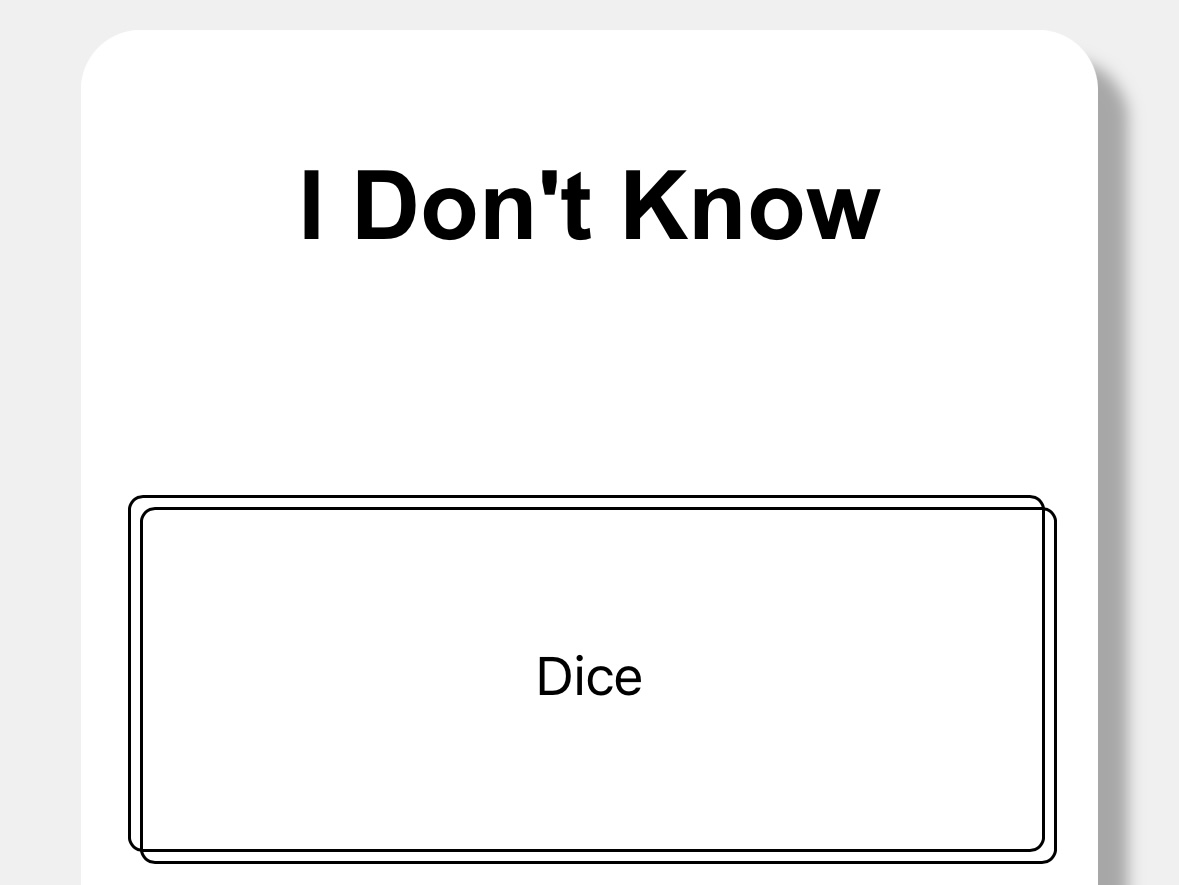
Web 3D
Mobile
Sensor
Machine Learning
A mobile app for users to make decisions via rolling dices, flipping coins, or asking for proverbs.
Wang Z.*, Bayly D.*, Roe C.
Proceedings of PEARC '25 (accepted, in press)
$1,700 Travel Award Recipient
View Paper →

• Developed 3D prototype with Three.js & D3.js for 15,000+ visualizations
• Implemented LLM-based classification methods (GPT-4o, LLaVA)
• Reduced loading from 500MB to 7MB through optimization
• Authored p5.js tutorials and led data viz workshops

• Built Colonial Networks visualization with D3.js & Leaflet
• Developed Python ETL scripts for art provenance data
• Integrated LLM-generated annotations for enhanced UX
• Presented at scholarly workshops on digital art history

• Upgraded COVID-19 Impact Project to WCAG 2.1 AA standards
• Created Globe.GL and D3.js visualizations for data storytelling
• Contributed to 2024-2025 Mega Grants Incubator Fund award
View complete work history on LinkedIn →
IMA Capstone: Guided 25+ seniors in prototyping and portfolio development; delivered 5 guest lectures
Code! 2: Taught JavaScript and p5.js; implemented auto-grading scripts
Applications: Facilitated graduate seminars and peer critique sessions
Shared Minds: Co-taught computational media (ML, databases, 3D graphics)
Code! 1: Instructed JavaScript/p5.js; graded 300+ projects
Interaction Lab: Co-developed syllabus; led workshops in Arduino, Processing, fabrication; mentored 40+ students
Python, JavaScript/Node.js, SQL, R
D3.js, Three.js, Leaflet, Globe.GL, Observable, Pandas, NumPy, DuckDB, Matplotlib
React, WordPress, p5.js, REST/GraphQL APIs, WCAG Accessibility
Docker, Git, AWS, Kubernetes, Tableau, ArcGIS